Marketing attribution 101: Which model is right for you?
How do you choose which marketing channels to invest in? Budgets aren’t bottomless, so choosing the right channel is critical. The wrong decision can cost your business dearly, so it pays to get it right.
Marketing attribution models link conversions and revenue to the channels and campaigns that brought in your customers. This data provides hard numbers to inform your decisions and justify your spend.
What is marketing attribution?
Put simply, it’s the process of assigning value to the various marketing touchpoints that a customer interacts with during their path to purchase.
Types of marketing attribution models
There are three basic types to consider: first click, last click, and multi touch.
Within those structures, the most effective models provide insights into:
- the messages a prospect was exposed to and where
- which messaging gets the best results from each customer
- which touchpoints have the greatest impact on a potential customer’s decision to buy.
Let’s examine six attribution models and how they work, then take a look at which could work for your business.
First touch attribution
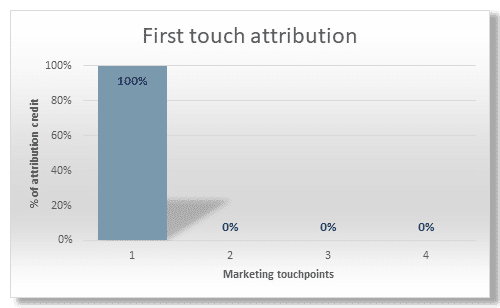
First touch attribution gives credit to the very first marketing touchpoint a prospect encounters, regardless of any subsequent engagement. For example, if someone finds you on a Google search, then subsequently converts after seeing your Facebook ad, all credit goes to the initial search as the first touchpoint.
The rationale is simple; your customer wouldn’t have been aware of your business, product, or service if the first interaction hadn’t happened. Thus, full value is assigned to that channel. This method is particularly useful for marketeers wanting to understand top-of-funnel behaviour to broaden their reach and impact.
Last touch attribution
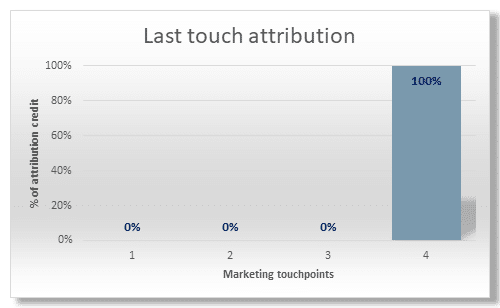
Last touch attribution gives full credit to the last touchpoint before buying. It doesn’t take into account prior interactions and assumes that the last touchpoint was the driver behind the conversion. For instance, if a prospect discovers your website through a Facebook ad, then uses your mobile app to buy your product or service, all credit is assigned to the mobile app.
Last touch attribution can help you uncover the ‘deciding factor’ leading to the purchase.
Known as single touch models, both first and last touch attribution methods overlook the broader customer journey, and the touchpoints that influence prospects along the way.
Multi touch attribution models
Multi touch attribution considers all touchpoints along the customer journey. They assign a value, or a weighting, to each of those channels. Each model assigns value differently, depending on when the interaction occurred.
Linear attribution
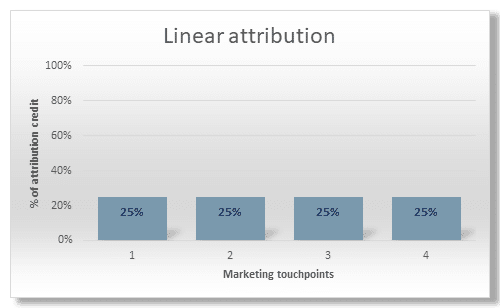
The Linear model recognises every touchpoint your customer engages with – from their first interaction, all the way to conversion, equally. It’s very useful to track and understand the content your prospect engages with at each stage of their journey.
Say someone clicks on your Google pay per click (PPC) ad and visits your website. They join your email list, and you start retargeting them through Facebook. They’re highly engaged with your content, so they click on your ads. In the meantime, you’ve also sent them an email, and they’ve clicked on a link and converted. The Linear model gives equal credit to all four channels – PPC, website, Facebook paid ads, and email.
U-shaped model
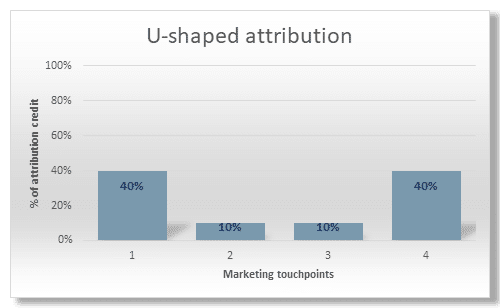
The U-shaped model assigns 40% of the credit to both the first and last touchpoints, with the other 20% divided equally between other touchpoints in between.
The strength of this approach is that you can identify the combinations of touchpoints that are most likely to hook and convert prospects. You might find that PPC is a great way to capture prospects at the start of their journey but, after they’ve done a bit more research, they convert following an organic search and visiting your website.
W-shaped model
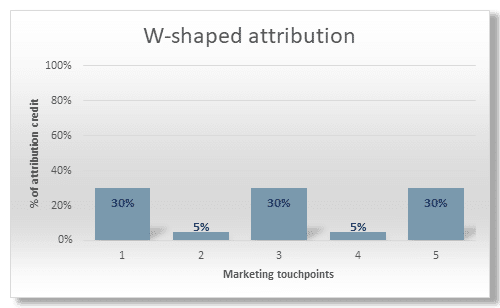
Much like U-shaped attribution, the W-shaped model gives credit to the first and last touchpoints, but it also assigns the same value to the middle of the funnel. The remaining 10% is then credited equally to any other touchpoints in between. This helps you understand the touchpoints that help move prospects further down the funnel.
A typical journey might look like this: your prospect comes across your brand through an article they saw on LinkedIn and visits your site to read more. A remarketing ad targeting their specific interest leads them back to your site. Following this, they download one of your eBooks on the subject, before joining your mailing list. A Facebook post brings them back to your site again, then a follow up email campaign triggers a sale. The W-shaped attribution model gives equal credit to LinkedIn, the eBook, and the email. The remaining 10% would be split between the touches in between – in this case, the remarketing ad and Facebook post.
Time decay attribution
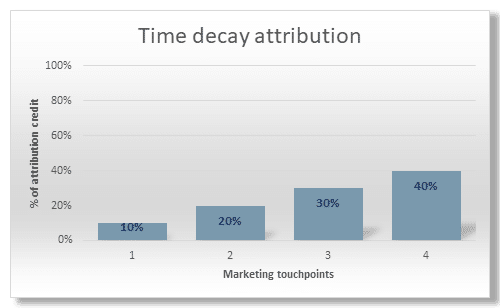
The time decay model also credits each touchpoint differently on the path to purchase. It’s an ascending scale with the first touchpoint assigned the lowest value, and the last interaction before conversion assigned the highest.
This model assumes that bottom-of-the-funnel interactions have a greater impact on a consumer’s decision to convert, so it assigns the most importance to that final interaction. For example, imagine someone follows a link to a blog on your website. After their visit, you start retargeting them, and they sign up to receive regular newsletters. Then an email campaign from you pushes them over the line to conversion. Time decay recognises momentum from earlier interactions but emphasises the importance of the final stimulus; the email receives significantly more credit than the referral source.
Choosing the right attribution model for your business
There’s no one-size-fits-all model. Your marketing mix, customer journey, and the length of your sales cycle are all factors that you need to evaluate.
You also need to consider how customers get in touch. If phone calls are important, you’ll need to use an attribution model and platform with the ability to track and correlate your online and your offline responses to create the most accurate insights.
Single touch models like first and last click attribution are useful for companies that have a shorter sales cycle. They’re very effective at measuring direct response and brand awareness campaigns.
For businesses that have longer customer journeys, with multiple interactions contributing to a conversion, the time decay, or U- or W-shaped models, are likely to provide you with better insights. A longer journey is likely to mean a more complex one, and you’ll want to understand which touchpoints are effective at each stage of the process.
Get more accurate insights into your customers’ buying behaviour
Finding out which touchpoints in the customer journey have the greatest impact on their decision to buy makes it easier to make productive decisions.
- By understanding which touchpoints lead to your most valuable conversions, you can adjust your marketing spend to optimise the most profitable campaigns.
- You can improve targeting by better understanding the messages, images and channels that customers respond to and when.
- With accurate insights, you can reach the right customer, at the right time, with the right message, to increase conversions and improve your marketing return on investment.
Mediahawk pinpoints which marketing activity brings you the most leads. Take advantage of powerful call intelligence, attribution and reporting which really make a difference to your bottom line.
Learn how marketers use Mediahawk’s comprehensive reporting to link marketing activities directly to revenue for 100% attribution.

