How to extract deeper marketing insights and improve conversions with call tracking

Written by Natalia Selby

How do you create ‘cut-through’ in your marketing campaigns and improve conversions?
At the risk of stating the obvious, you first need to know what’s working – and what’s not. As marketers, we have an ubiquity of data at our fingertips. Undoubtedly though, the biggest hurdle is understanding how to organise this data to get significant insights from your marketing activity. This is where secondary dimensions in Mediahawk are instrumental.
What is a dimension?
Google Analytics defines a dimension as a “descriptive attribute or characteristic of an object that can be given different values.”
Examples of dimensions in Mediahawk are Sources, Mediums, Keywords, Number Sets, and Pages. Values for the Sources dimension would include Google, Direct, Email, or Referral, for example.
For each dimension, Mediahawk provides you with metrics to measure these values, e.g. Effective (answered) Calls, Unique Calls and Visits.
Why are secondary dimensions important?
By default, the majority of reports usually show just one dimension along with the relevant metrics. This can tell you how many calls Email generates for you over a given timeframe, as an example. However, by looking at only one dimension and the corresponding metrics you’re only examining your data at the first basic segmentation level.
Secondary dimensions allow you to layer additional attributes to your reports, providing you with more insight into the main dimension. So, taking Email as an example, by adding a secondary dimension of Campaign, we can drill down into the individual campaigns generating calls to determine which email campaigns are more successful.
Define your own secondary dimensions
Mediahawk allows you to define your own custom values that you want to analyse your data by. Below are some examples of values you can add:
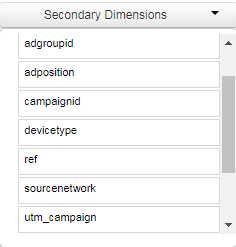
There are many ways this can be used, but let’s take another scenario of analysing PPC response. You might think that by increasing your maximum bid and maintaining position 1 for your ad is keeping leads flowing. By adding ‘Ad Position’ as a secondary dimension, you can drill down into which ad positions actually result in a greater ROI. You may find that position 2 is generating an equivalent number of leads and revenue for a much lower cost-per-click – saving you money.
Secondary dimensions in action
Let’s say you’ve launched a multi-channel campaign called ‘Hot June’. It might look something like this:
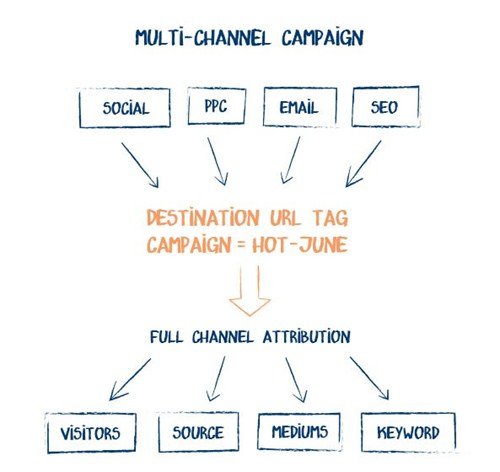
The campaign is going well: generating traffic and both online and phone conversions. So, to generate more conversions, you need to identify which channel is more successful for this campaign. But how do you isolate conversions and revenue generated by a specific campaign, and attribute this to a precise source, medium… even keyword?
Web analytics typically convey data within a given hierarchy, and you’re able to drill down and pivot the information to a certain extent. However, this still doesn’t give you complete marketing response data – and you certainly won’t get precise revenue attribution from web analytics alone.
Taking our ‘Hot June’ campaign as an example, most of our budget will be spent on PPC activity and, naturally, we want to know that we’re generating an adequate return for this investment.
Using custom tags in Mediahawk, you can define the values you want to track and analyse your data by:
- For the email campaign, for example, I might append the following tags to the URL:
https://www.mywebsite.co.uk/?utm_source=newsletter&utm_medium=email&utm_campaign=HOT-JUNE - One of my PPC ads might look like this:
https://www.mywebsite.co.uk/?utm_source=google&utm_medium=cpc&mh_keyword={keyword}&utm_campaign=HOT-JUNE - And my social media might be tagged:
https://www.mywebsite.co.uk/?utm_source=twitter&utm_medium=social&utm_campaign=HOT-JUNE
Because all assets are tagged with the same utm_campaign parameter, I can drill down into all response for this campaign. The data I can see includes:
- The number of visits and calls each channel generated.
- The entire visitor journey, including their first and last click sources, the pages they viewed, and the phone calls they made to us.
- My total spend on AdWords for this campaign, broken down by keyword.
In addition, with our CRM integrated with Mediahawk, the information is passed straight through so that leads are created instantly with all relevant marketing data included. This enables us to immediately see how many opportunities and how much revenue the HOT-JUNE campaign has ultimately generated.
This is the hard evidence that marketers need to justify spend. If you can see that the expensive keywords you’re bidding on aren’t generating leads that convert to revenue, you can quickly identify and remedy this. This gives you the ‘cut-through’ you need to run more efficient and effective campaigns, and improve conversions.